Download
the P-Chart-start.xlsx problem from the manf3000/labs folder on
the Manufacturing network drive. Using
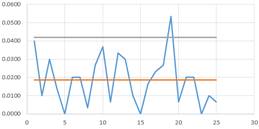
an Excel spreadsheet create and submit a process control chart for the problem. Along with the required graph please answer
the following questions: 1. What probability distribution is
the p-chart based on? 2. When is an np chart typically used,
rather than a p chart? Add the
document to your website along with sufficient discussion differentiating the
use of control charts for variables vs. attributes. Typical uses of each, as well as the
distributions used for each. The
information below shows the count of surface nonconformities in 1000m2
of 20-kg paper. Determine the central line and control limits. Please post the results to your web site
with discussion that includes the proper application of a “c-chart” Taken from
Besterfield:
|
||||||||||||||||||||||||||||||||||||||||||||||||||||||||||||||||||||