|
||
|
|
||
|
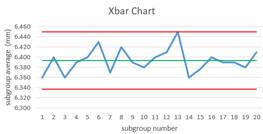
Find the Cypress-Bark-SPC excel file on the Manufacturing Network Drive (manf3000/labs folder). · Complete the grouped data analysis. Note that the specification limits are 75 to 130kg. Be sure to put in the normal curve over the histogram of the data array, and complete the Process Capability Analysis · Complete the Statistical Process Control (SPC) graphs: Xbar, Range, and X chart for individuals. Apply all control limits and tolerance limits (where applicable!) · Determine the process capability Cp using the SPC charts information. Does it show any difference from the grouped data analysis? · Complete a .htm document with the analysis. Include sufficient discussion on the document to convince the reader that you thoroughly understand the proper application of SPC. Compare the information from the grouped data and control charts. |