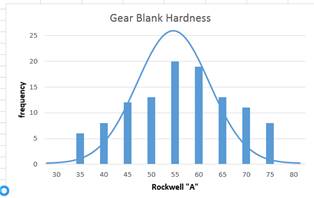
The grouped data lab excel spread sheet can be found on the Z: drive in the manf3000/labs folder: RockwellA-readings.xls. Please complete the worksheet, and write a brief (one page) explanation that convinces the reader that you understand: · Measures of central tendencies · Measures of dispersion · Kurtosis and Skewness · Tolerance Limits · Process Capability, both CP and CPk. · Be sure the frequency distribution shows a bell curve overlaid on the graphic, and explain why it is there. As reference material please use Rufe, beginning on page 461, and STOPPING at section 46.3 Control Charts on page 464. You must use a word or a .pdf document to display your graphics and write the report. You may link to the excel spreadsheet to provide data, but do not save the spreadsheet as html and simply post that. It is too difficult to make a professional looking report on a spreadsheet. Do not spend a lot of time on bells and whistles on the page. Content, with a nice clean and readable layout will receive the best grades. Link to American Society of Quality |